One of the biggest issues front-line claims people face is the volume of information that must be understood before knowing what to do next. Multiply that volume by the number of claims in a typical portfolio and you can feel the stress of potentially missing something and negatively affecting the claim outcome.
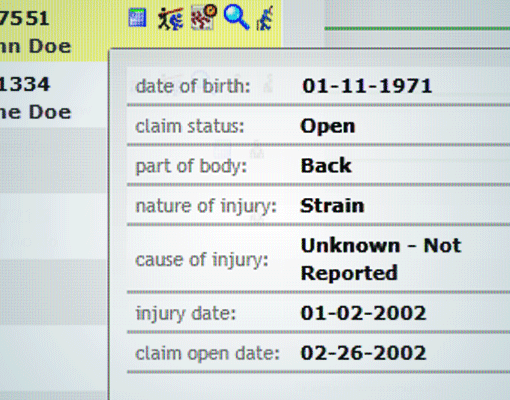
Claim-Maps gives summaries (like the one pictured here) and displays events visually on a timeline the user can move through quickly, by day, month, or even year. The user can also filter to show any combination of events–medical, legal, and claim–and any combination of smaller details, including (but certainly not limited to):
- Opioid prescriptions
- Physical therapy
- Payments
Claim-Maps drastically improves efficiency, giving adjusters x-ray vision to cut through mountains of data and understand what to do next.